
Allocation of Responsibility in Construction-Defect Litigation - by Pete Fowler. An abridged version was published with the title From the Ground-Up: Allocation of Responsibility in Construction-Defect Litigation in CLM's Construction Claims Magazine - Winter 2022
Introduction
Construction defect litigation claims come in all possible project types, sizes, and ownership structures. It does happen that some construction defect (CD) claims are related to a single party, but it’s rare. There are usually multiple parties who share responsibility; sometimes there are dozens. So, the mechanism for allocating responsibility needs to be flexible from a single issue on a small project to more than a hundred allegations, occurring at hundreds of locations, to dozens of parties.
Because allocation is complicated we’ve engineered this process to assign supportable portions of the cost to repair defects and other damages to each responsible party. The process requires thoughtful claims professionals, experienced lawyers with understanding of insurance coverage, experts who understand defect, analysis, and contractual roles & responsibilities, and a detail-oriented team to transform mountains of data into solutions. This article takes the perspective of a key direct defendant team, like a developer or general contractor who was sued by an owner. Our defendant then sues subcontractors, who then sue sub-subcontractors and each other (Figure 1); but the process is applicable for all parties. ”Allocation” is mostly “science,” but critical parts include the “art” of applying professional judgment. This making a sensible list of defects (“issues”) that can be allocated, assigning values to each issue or category, making a list of all possibly involved parties and understanding their role in the project, and assigning justified portions of responsibility for each issue. A real, professional, supportable allocation has a lot of moving parts. There is lots of math, connected spreadsheets, and professional judgment from expert witnesses and lawyers.
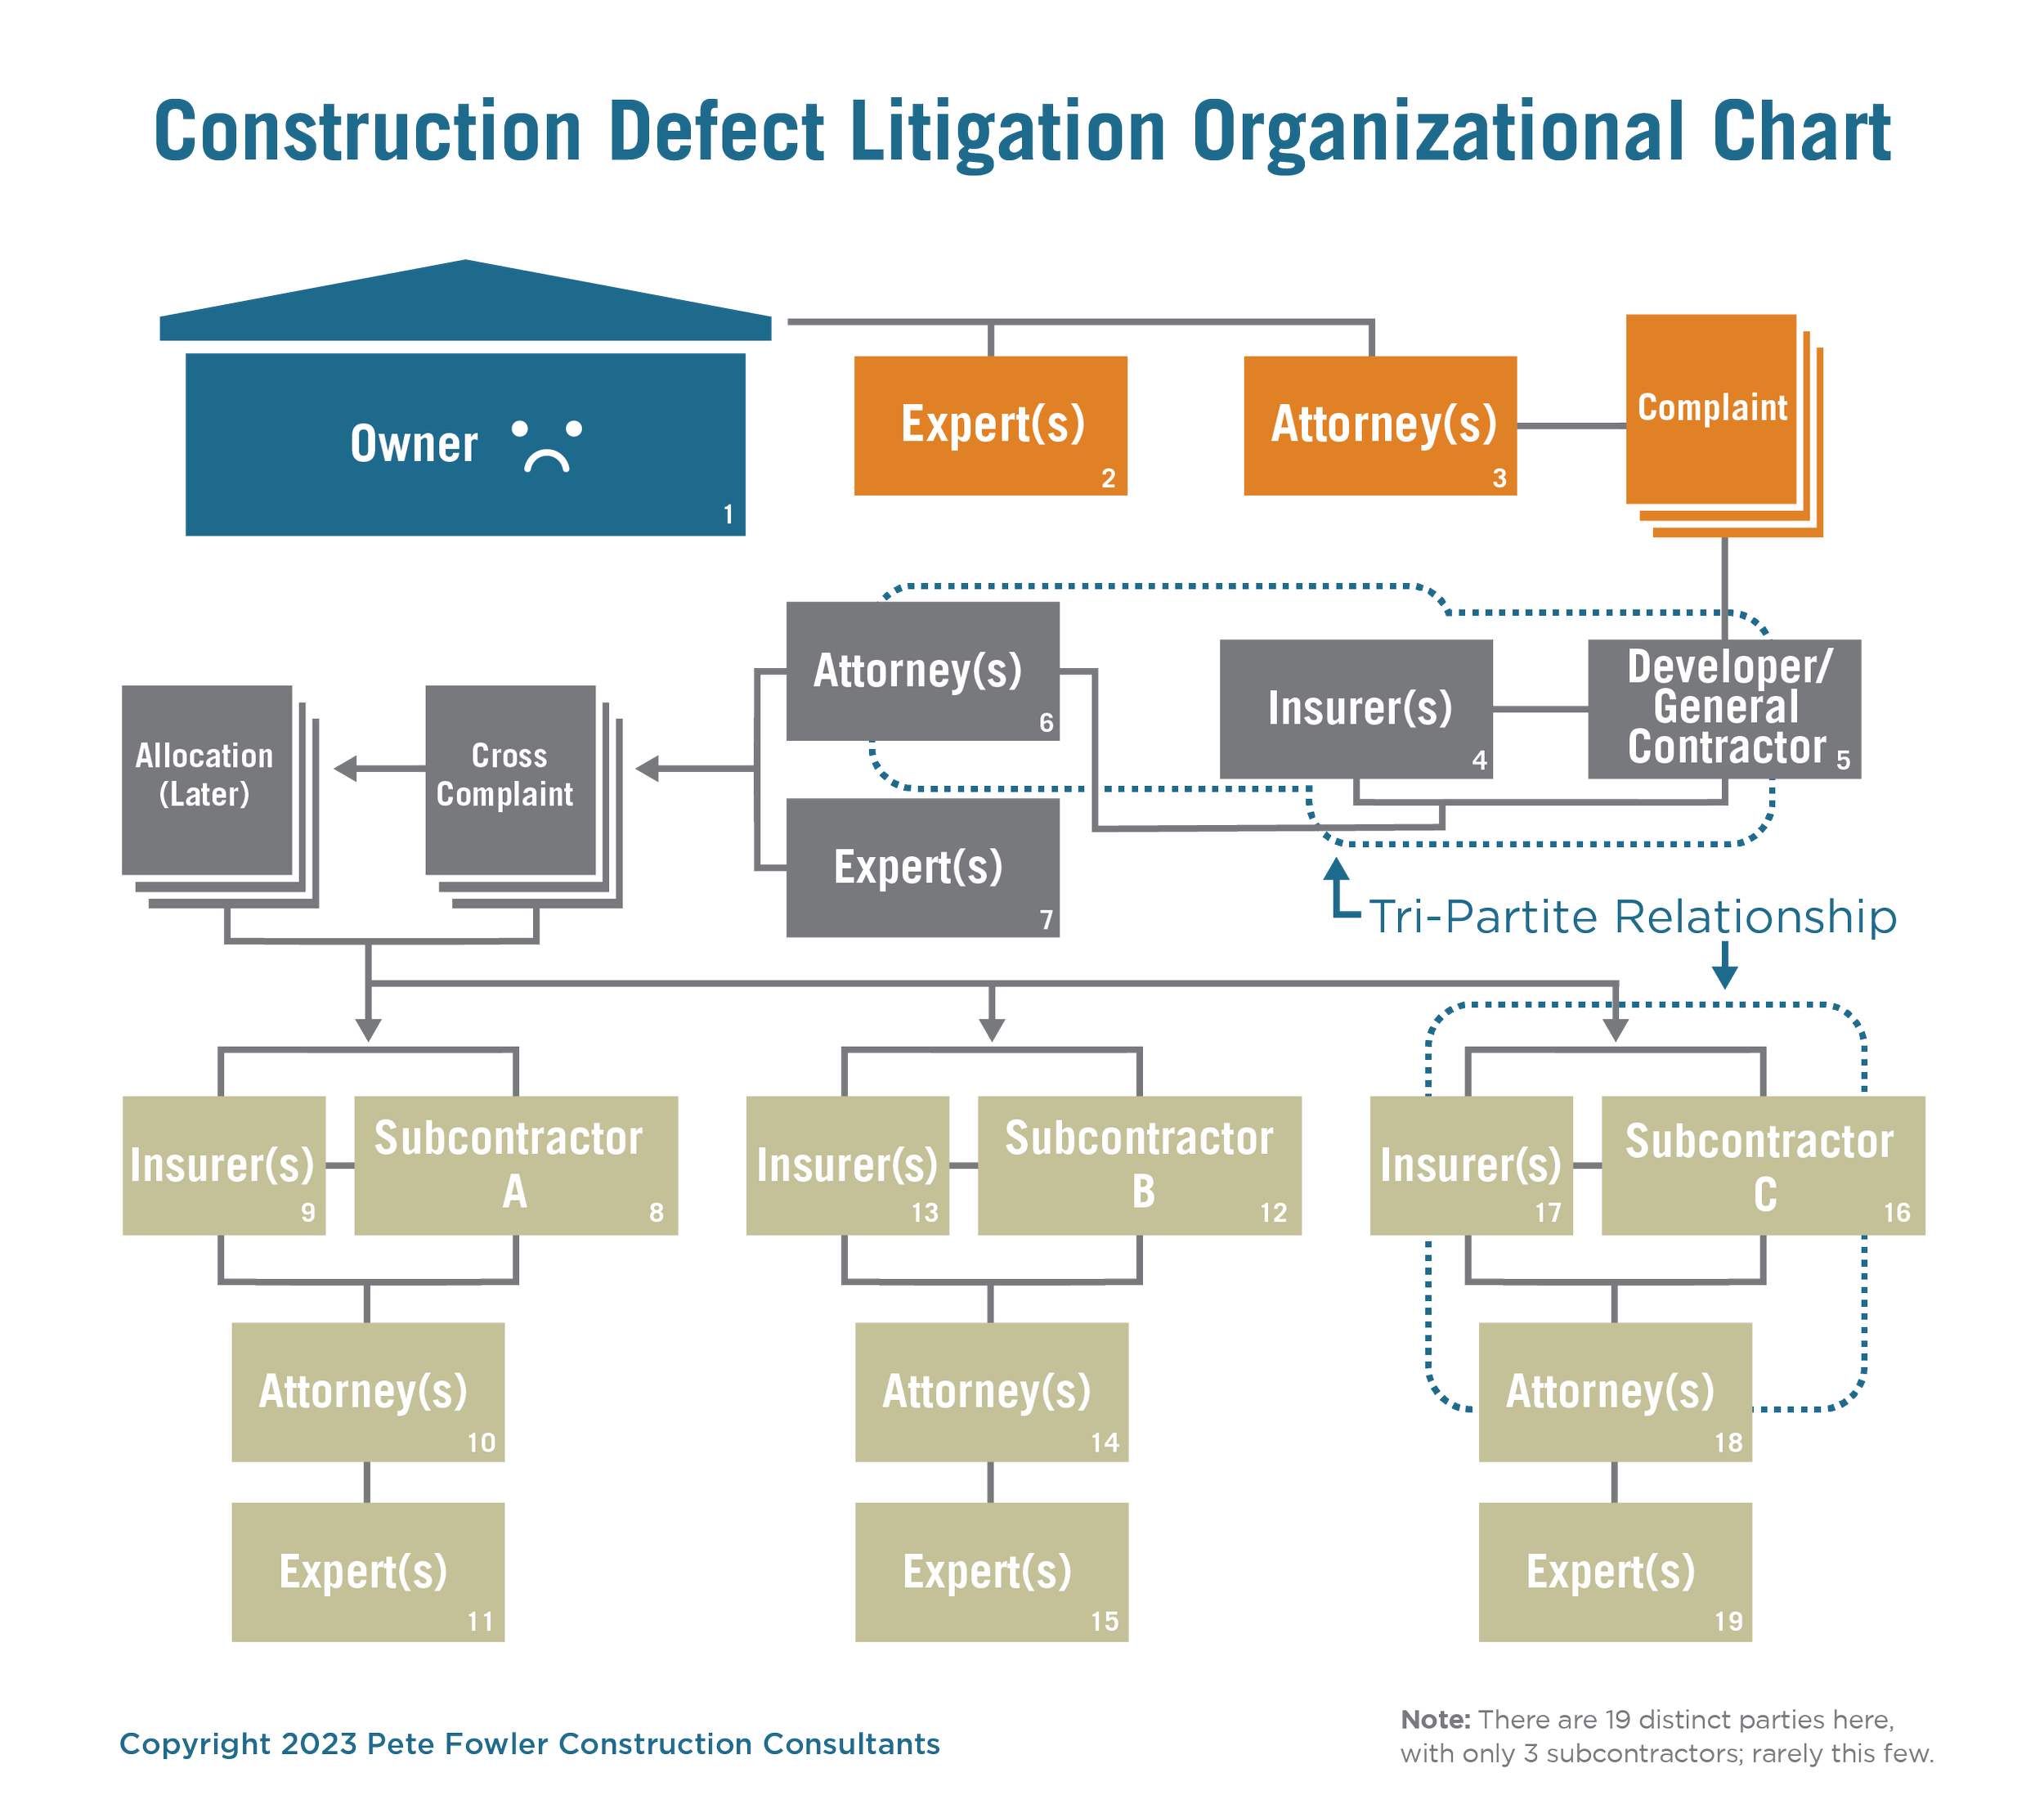
Figure 1
Working Backwards
Since most claims settle we won’t address trial or arbitration, although much of the work to support our claims against each party will be used if trial becomes necessary. So we will work backwards from a successful mediation. To succeed in settling a multimillion dollar case with dozens of issues and more than a dozen defendants, the mediator, lawyers, and experts need information that allow them to understand the big-picture, and to drill into details when making their case. (Seeing the forest and the trees.) The culmination of our allocation is a 1 or 2 page, tip of the iceberg, spreadsheet called Allocation Summary with Settlement Ranges (see Figure 2).

Figure 2
This document is typically not shared with other parties. It has a list of all the Players on the left, a column for important Settlement Notes, columns for one or more allocated costs, and two columns on the right for low and high potential settlement amounts. Each column of allocated costs is a separate Allocation Analysis, as described later.
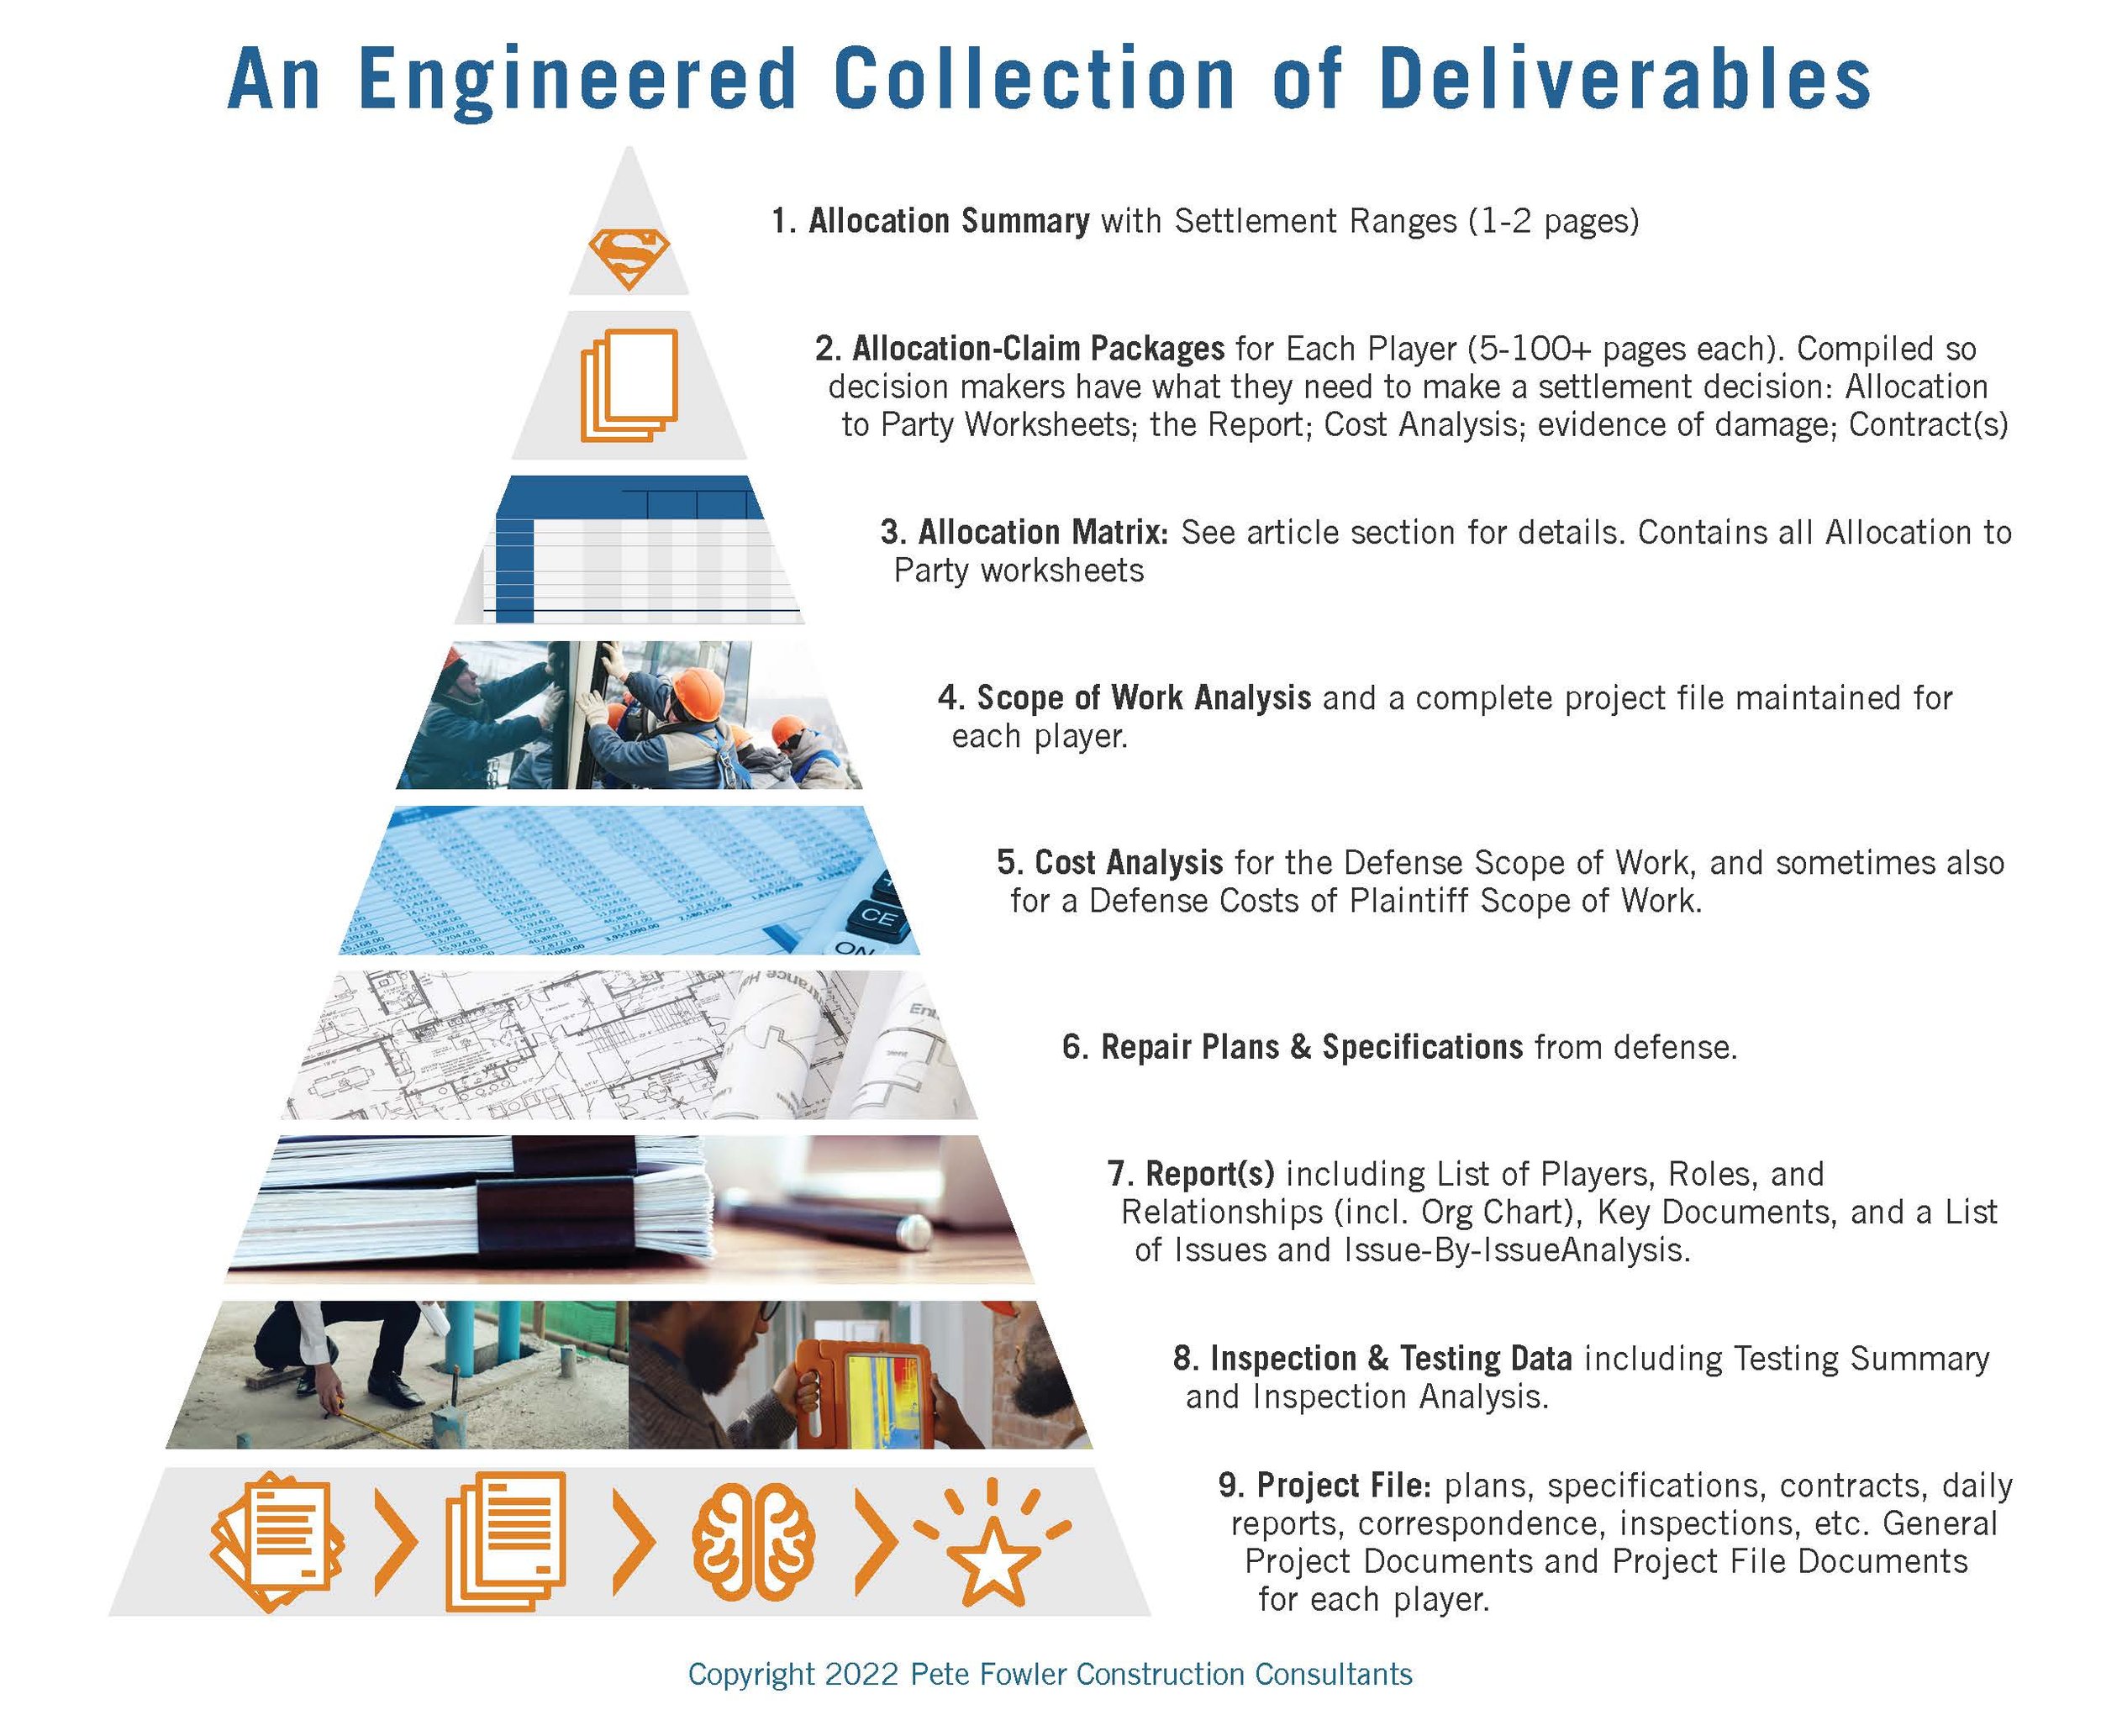
Figure 3
Analyzing Construction Defects
Expert building investigations include (1.) collecting, organizing, and summarizing a large volume of project data; (2.) preparing for and executing onsite investigations including visual inspections and diagnostic testing that conform with myriad technical consensus standards; and (3.) conducting interviews and reading testimony. The investigation should generate all the data necessary for experts to support their thinking, writing, and presentation of expert opinions that solve the alleged problems. It is conceptually simple, but not easy.
Before allocating responsibility we must analyze each of the issues, considering all alleged locations. Like the Allocation, this is mostly “science,” but some parts include the “art” of applying professional judgment. First, make a 100% list of all issues. Identify where each issue occurs. Consider all locations where they COULD occur, that is, total population vs. allegedly defective population. Decide if issues will be repaired. Answer how defective conditions will be identified. Understand what other parties say about the method of repair. Answer how much the repairs will cost and what other parties say about costs.
(Figure 3) The “Engineered Collection of Deliverables” show Inspection & Testing Data Analysis as a foundation for all further work. It includes detailed inspection and testing photographs, notes, diagrams, and marked-up plans, Inspection Summaries, Testing Summary & Maps, and Testing Analysis Reports. Then experts can compose Reports that range from a couple pages to hundreds. On projects large enough to warrant Allocation, reports typically exceed 100 pages.
The most difficult, lengthy, and important part of a CD report begins with a list of all issues and then the “issue-by-issue analysis” for each. We begin each issue analysis with a plain language summary that everyone can understand. That is followed by a detailed investigation section that summarizes the document reviews, interviews, inspection, testing, and more, that were performed to inform our understanding. Next is the analysis of the Project File. Our analysis often includes composition of images, maps, plans, and other visual aids for communicating this highly technical information. The conclusions for each issue might include a scope of repair, a list of responsible parties (later included in Allocation), or an “allocation by trade” if we do not yet know who did what work and where. Finally, published costs for each issue are summarized.
We sometimes compose Repair Plans & Specifications from the defense perspective. Once we have performed enough work to outline our scope of repair, we begin our Defense Cost Analysis of Defense Scope. Sometimes we have already composed a Defense Cost Analysis of Plaintiff Scope when the plaintiff’s estimate is outrageous.
Allocation Matrix
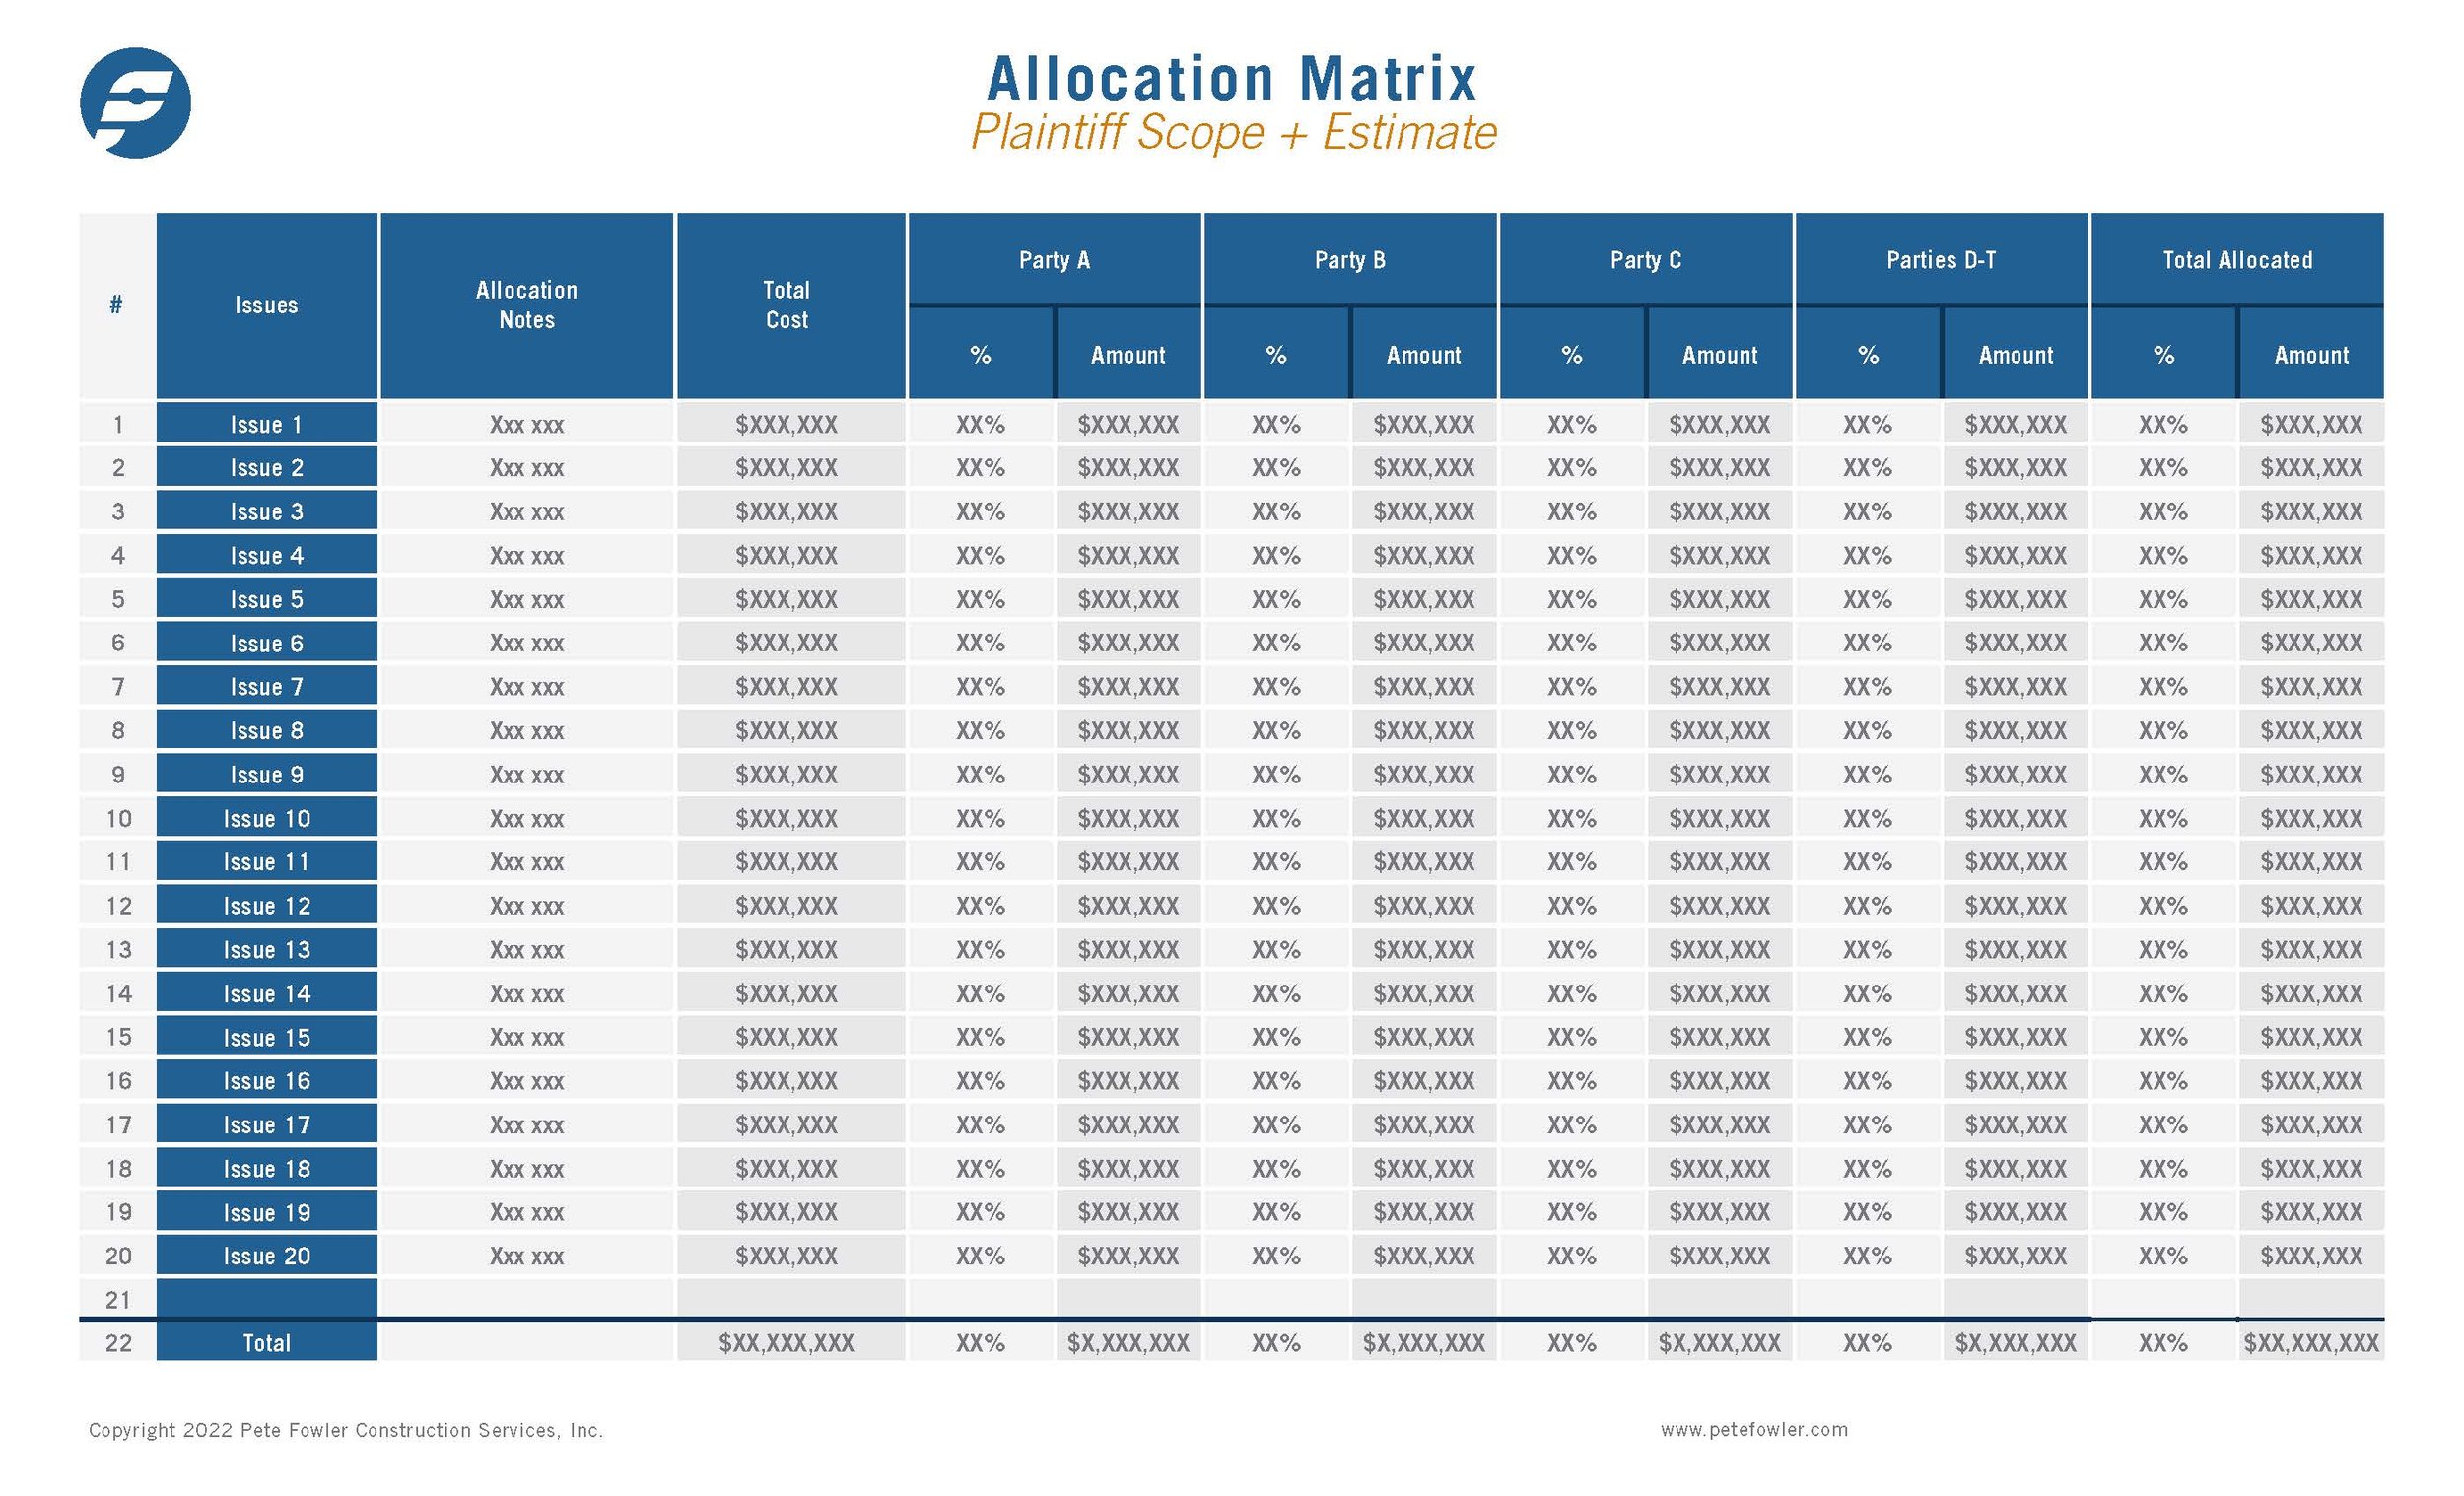
Figure 4
The Allocation Matrix includes a complete issues list down the left side and the players are across the top (See Figure 4). Each party will have at least two columns: “% Responsible” and “$ Amount.” The $ Amount is a simple calculation of the total cost for that item times the % Responsible. This matrix requires fancy formulas to do the math, including math checks, to make sure there are no errors. This can get complex when there are lots of issues, lots of parties, and is then further complicated when multiple parties work on the same trade in various phases or physical areas.
A simple analysis will have only one Allocation Matrix worksheet. If you want multiple analyses, like when we allocate the plaintiff and defense costs, or to allocate the same costs in two ways as with a joint & several versus a 100% allocation, then the worksheet with issues and players can be copied and populated using the different costs and/or percentage allocation figures. This matrix should be formatted with page breaks to output as Allocation to Party Worksheets, with the total cost and the “%” and “Amounts” columns for each party, usually 1-4 pages. If the issues list is short and can fit on one page, the entire Allocation Party Worksheet can be formatted to print one page for each party. In contrast, we have created Allocations where the issues list was 4 or more pages long; we performed multiple allocation scenarios (plaintiff costs, defense costs of plaintiff scope, and defense costs both joint and several, and 100%); we allocated to dozens of parties, so the Allocation Matrix documents were many hundreds of pages long.
The creator of each Allocation Matrix can create an Allocation Summary sheet: a simplified list of all the parties’ total allocated project amount either linked to the Allocation Matrix worksheet or straight to the Allocation Summary with Settlement Ranges (see Figure 2).
Who - What - Where
For each issue we use the Project File to try to figure out who did what, and where. For example, if the first issue is roof leaks, and there were two phases of construction, do we know who installed the roofs on both phases? For more complex issues like waterproof decks, we might need to dig to figure out the cause of problems and who might be responsible including the architect, engineer, framer, sheet metal fabricator/installer, door installer, waterproofing applicator, tile installer, siding contractor, handrail installer, and the general contractor who was supposed to coordinate all these parties.
As we begin assigning % Responsible in the Allocation Matrix, we often need to make multiple passes across the general and player Project File to prove who did exactly what and where. In some circumstances there will be more than one party that performs work on the same trade, but in different locations. If there are two project phases, one with 2 buildings and the second with 3, all of the same size, then phase 1 is 40% and phase 2 is 60% of the roofing. This is an iterative process. To decide on and support the % Responsible we cycle through the report and the project files multiple times, learning and documenting more and more with each pass. Scope of work and allocation data is often best presented graphically using photographs, diagrams, images, maps, and plans, both in the report and in the individual Allocation-Claim Packages.
This evidence collected should be memorialized in the issue-by-issue section of the report and/or in the Allocation Claim Package Memo for each player. The organization of this information is important and complex and if it is only saved in the brain of an expert or attorney, then it is a terrible system! Since we are commonly dealing with thousands to hundreds-of-thousands of documents, we rarely have 100% mastery of every piece of data. It is common for other team members or opposing parties to find information that needs to be integrated into our analysis. Some of this new information should change our opinions about the % Responsible; we must remain open to this possibility.
At this point, we have all of the information we need to complete a Joint & Several Allocation on any of the costs (plaintiff, defense costs of plaintiff scope, or defense scope) since we know who did what work and where. Joint & several liability, to me (a simple construction guy) means that if you are 1% responsible, then you might pay 100%. This is a consumer protection aspect of law that means if there are two responsible parties but only one has the means to make the consumer whole, then the one could end up paying a larger percentage of cost than their percentage of responsibility. We know each state has different laws on this but that’s beyond the scope here. For our roof example, the two roofers would never get more than 100% of the portion of the project they worked on: so 40% and 60% of the total roofing costs, respectively.
In our deck example we identified 10 parties that could have shared responsibility. If any one of those were the only one with the means to make the consumer whole, then they could end up paying 100%. With this in mind, we could populate the Allocation Matrix with 100% for each of the 10 parties. So yes, this means we have allocated 10 times the cost total for that line item. Depending on the complexity of the issues, the grand total of a Joint & Several Allocation will generally fall between 1.5 and 4 times the total project cost. And yes, that means small players get an out-sized allocation. But, other than the percentage allocation amount (100% to everyone) this output should not get much argument. It’s a supportable analysis of who, what, where, and how much for the entire collection of defect allegations, and does not require much “professional judgement.”
Professional Judgement
Prior to the Joint & Several Allocation of the Plaintiff Estimate, we usually “normalize” the cost analysis of parties to make the allocation clearer: each defect has a “total burdened” cost that will be allocated across the responsible parties. To allocate all of the costs to all the issues (in the left-most columns of the Allocation Matrix), the Total Cost needs to include direct costs, indirect costs like general conditions, overhead, profit, and other project costs including design, permits, third-party management and inspection, alternative living expenses, etc. Attorney fees and other litigation costs need to be handled somewhere. We prefer them as separate line items outside Total Cost column. This requires professional construction cost estimating expertise, good judgement, coordination with the lawyers to make sure everyone knows what is and what is not included, and a couple decades of CD experience helps.
After all of the above, we can make “% Responsible” (allocation) judgements for a “100% Allocation” (not 99%, not 101%) for each issue, and feel confident that we have the evidence to argue persuasively. The “science” part of an allocation is figuring out who MIGHT have 1% or more responsibility. The “art” or professional judgement part is where we decide who is more and less responsible, like when we have assemblies like the waterproof deck described previously.
For the most complex and expensive issues we perform what we call a “Contracting 101 Analysis” of the roles and responsibilities of each party by looking at both the physical construction, performance, and damages, as well as the project specific contractual obligations and industry “standards of care.” From our deck example: architect 5%, engineer 0%, framer 10%, sheet metal fabricator/installer 5%, door installer 10%, waterproofing applicator 25%, tile installer 20%, siding contractor 5%, handrail installer 10%, and the general contractor 10% (Total 100%). When presented to the parties, this is where the wailing and gnashing of teeth gets loud. In mediation, when a party argues that their responsibility on any issue is less than my analysis, I invite them to go discuss it with the other parties allocated on those issues. If they can work out the percentages amongst themselves to redistribute my 100%, then I will consider it (They never like this answer ;-).
When the Allocation Matrix is set up correctly and each of the issues is allocated to the various parties totaling 100%, then the allocation totals to all of the parties should add up to the Total Cost column at each issue and at the total on the bottom line.
At the conclusion of allocating, by any one or more methods (plaintiff or defense, joint & several or 100%) the totals for each player can be linked to the Allocation Summary with Settlement Ranges worksheet (Figure 2). Then the team can consider, party-by-party, Low and High Settlement Ranges (left most columns) based on the overall project settlement value. This is, in allocating responsibility, the ultimate act of applying professional judgement.
As everyone can imagine, the discussion and arguments of % Responsible for each issue, and for each player being allocated to, can go on for much longer than we have room for here, by attorneys, experts, insurers, and the defendants themselves. And we here have dramatically simplified this work by only touching on the issue of insurance coverage. The resolution is sometimes only concluded by a judge or jury.
Making a Case
We have done a lot of work, but there is little value until we make a compelling argument to the people we expect to help pay for a settlement. Much of the work described here gets compiled, party-by-party in individual Allocation-Claim Packages, that are described in Figure 3. To make big, supportable claims, we need to collect evidence that can be evaluated by the parties. The more plain language and graphic intensive this package is, the better. Small players can have smaller packages but big player packages need heft. Sometimes we compile a package for a major player and realize that in order to help other players make good decisions, we need to dig back into the project and investigation files to add additional information. (This is true for both plaintiffs and defendants.)
When mediation happens, the time to perform has arrived. In a large CD case, there are always surprises. If we have worked the way we have recommended here, the team will be ready. So much so that we often update an Allocation Matrix, Allocation-Claim Packages, and Allocation Summary with Settlement Ranges worksheet from a laptop during mediation.
Conclusion
Connecting all of the moving parts of a complex litigation matter requires organizational skill, technical expertise, and the willingness to apply professional judgment that people from opposing parties will argue with. It’s not for the faint of heart. The bottom line is that Allocation is complicated. The science has been “process engineered” here. The art of professional judgement is always going to be a big part of any complex litigation and can only succeed when smart people do hard work. When we do the science and the art, good information emerges that allows smart people to make smart decisions to help tough cases get resolved.